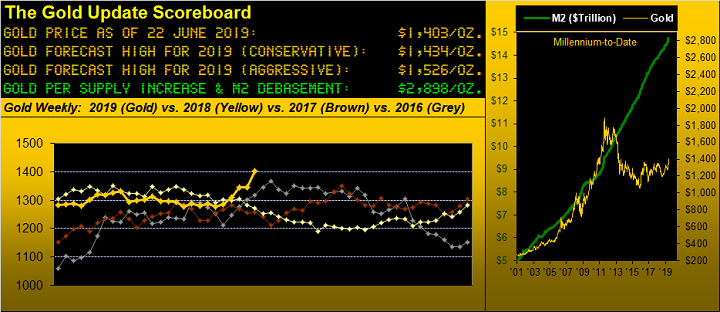
There are Gold breakouts and then there are Gold breakouts. The Gold breakout this past week above has been the most mentioned objective for some three years. It was more than just a technical achievement: 'twas price's forceful follow-through as foretold that really put the cherry on it.
'Course the fumbling FinMedia for quite a stretch of time cited Wednesday's Federal Open Market Committee's policy statement -- later echoed in Chair Powell's presser that "Many participants now see the case for somewhat more accommodative policy has strengthened" -- as attributable for Gold's big breakout. But such a response to the Fed only brought Gold up to 1366 before the price fizzled to 1361, certainly seen by those of you lucky enough to be scoring at home.
Yet Gold's real rocket-shot was Thursday's wee hours Iranian take-down of that U.S. drone over the Strait of Hormuz, swiftly propelling price initially to Base Camp 1377, at where (if you were still watching) there came the expected price consternation given that level's long-standing status of import, but then from which quick as wit the price further launched to 1396 lickety-split. Here in Monaco taking this all in as it unfolded, we were a bit miffed as to there being little reporting about the downed drone and that rather, 'twas instead furtherance to what the Fed had said, whilst granted Stateside, many folks were already tucked into bed.
But beyond currency debasement, when it comes to valuing Gold, ours is not to reason why, be it by FedSpeak or a drone plucked from the sky. And yet from our technical eye it has all played out -- at least to now -- as we said 'twould: the re-taking of Base Camp 1377 duly brought in the mo-mo crowd, many of which likely were pre-set algorithms waiting in the wings as programmed oh so long ago.
And thus the table is set for the price to proceed at minimum to our "conservative" forecast high for this year of 1434. This is portrayed in both the opening Gold Scoreboard and below in the weekly bars graphic. Indeed as the pilers-on came to the fore, the price went up even more on Friday before closing out the week at 1403. 'Tis Gold's highest weekly settle since that ending more than six years ago on May 10, 2013, when the price's downtrend was in the midst of a surprising span which would find Gold move to as low as 1045 come the cold winter in December 2015.
Since then, Gold's rise to today has been +35.4%, however Silver's net change for the same timespan is just +12.6%, from 13.62 then to 15.34 now. Is it any wonder the present Gold/Silver ratio is 91.5x, the millennium-to-date average being only 64.4x and thus by which the price of Silver today "ought be" +41.9% (at 21.78) higher than 'tis?
To be sure, since 2015, there have been various Gold breakouts, but none really to any level of substance. More often than not, Gold's most common breakouts have repetitively been either above or below The Box (1280-1240) ad nausea. But now, finally, this one above Base Camp 1377 we rightly characterize as significant. Yes there remains a long way to go to 2000 (+43% from here), yet this present breakout is worthy of being proclaimed as "One small step for Gold, one Giant leap for Goldkind." Fairly "Giant" indeed as we turn to Gold's weekly bars:
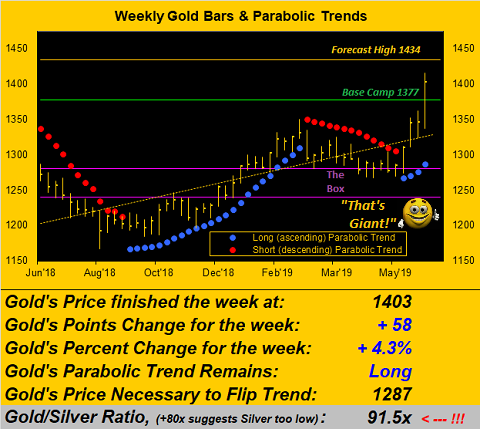
Now amidst all the Golden Jubilation we've this common sense note from the "Nothing Goes Up in a Straight Line Dept." By very near-term measures, Gold admittedly is quite upside stretched at present, which broader-term is a good thing as Gold returns to gaining substantive interest, and rightly so. Still we bear in mind that when Gold is driven by geopolitical events, their subsequent short attention span in falling from the news radar generally puts price back to where it had sat. Either way, from the website we've these two notable views:
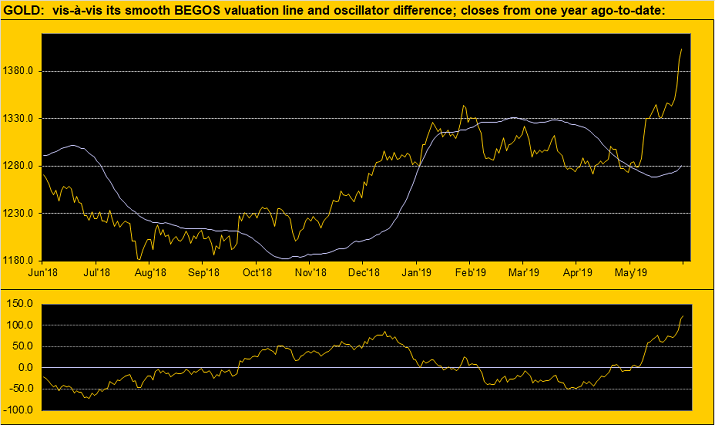
First is our one-year graphic of Gold vis-à-vis its smooth BEGOS valuation line, derived from how day-to-day price changes in the primary BEGOS Markets (i.e. the Bond / Euro / Gold / Oil / S&P 500) regress to those for Gold itself. Per the oscillator (price less valuation) in the lower panel of the chart, Gold reads as 123 points "high," (but 'tis of course some 1495 points "low" per the broader-based Gold Scoreboard's dollar debasement calculation of 2898). Still by this graphic, the current comparison of price with BEGOS valuation is at an historically high extreme:
Second is our three months-to-date view of Gold vis-à-vis its Market Magnet, the oscillator at the graphic's foot in this case being price less magnet. And current distance from the magnet of nearly 43 points also is extreme as price rarely veers from it for too significant a period of time, let alone distance, (hence the designation "magnet"):
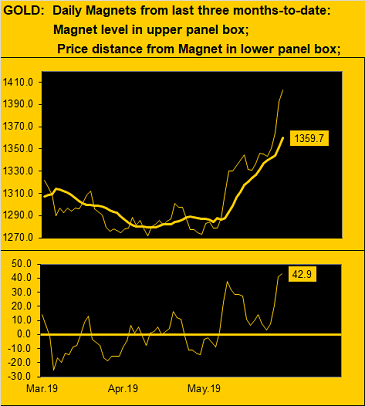
Again, the above two near-term extremes in the broader sense are finger-posts to still higher levels, the more immediate one we seek as 1434, after which we can then reassess the year's "aggressive" forecast notion for 1524 (also per the Gold Scoreboard).
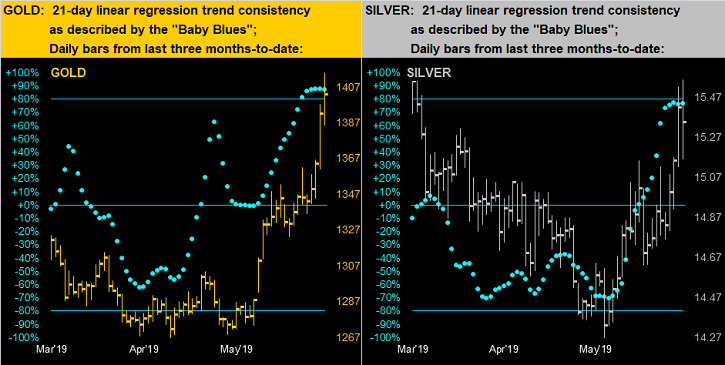
As to more nitty-gritty in "The Now," let's turn to our two-panel graphic for the past three months-to-date of Gold's daily bars on the left and those for Silver on the right. In looking at the baby blue dots of linear regression trend consistency, they are in both cases appearing a bit toppy. And as you website followers know, upon the dots declining from above the +80 level to under it, lower prices generally are in the offing:
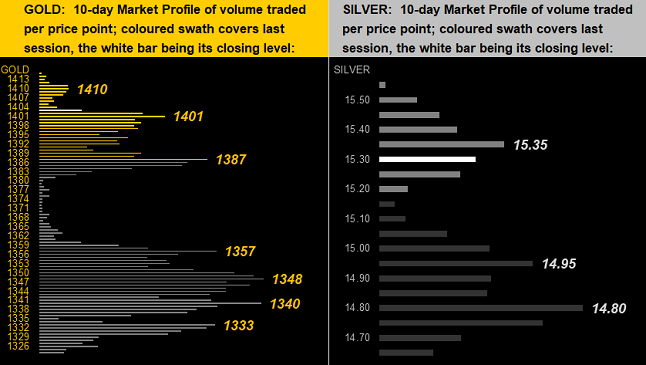
As to the precious metals' respective 10-day Market Profiles for Gold (below left) and Silver (below right), you can see (and certainly so for the former) the dearth of trading volume, indeed for Gold from 1357 up to 1387. Thus we offer that, too, as a bit of a near-term cautionary note. But at the end of the day, confirmation of the Base Camp 1377 battle as having been won shall be upon its solidifying what was resistance across these past three years as having morphed into support:
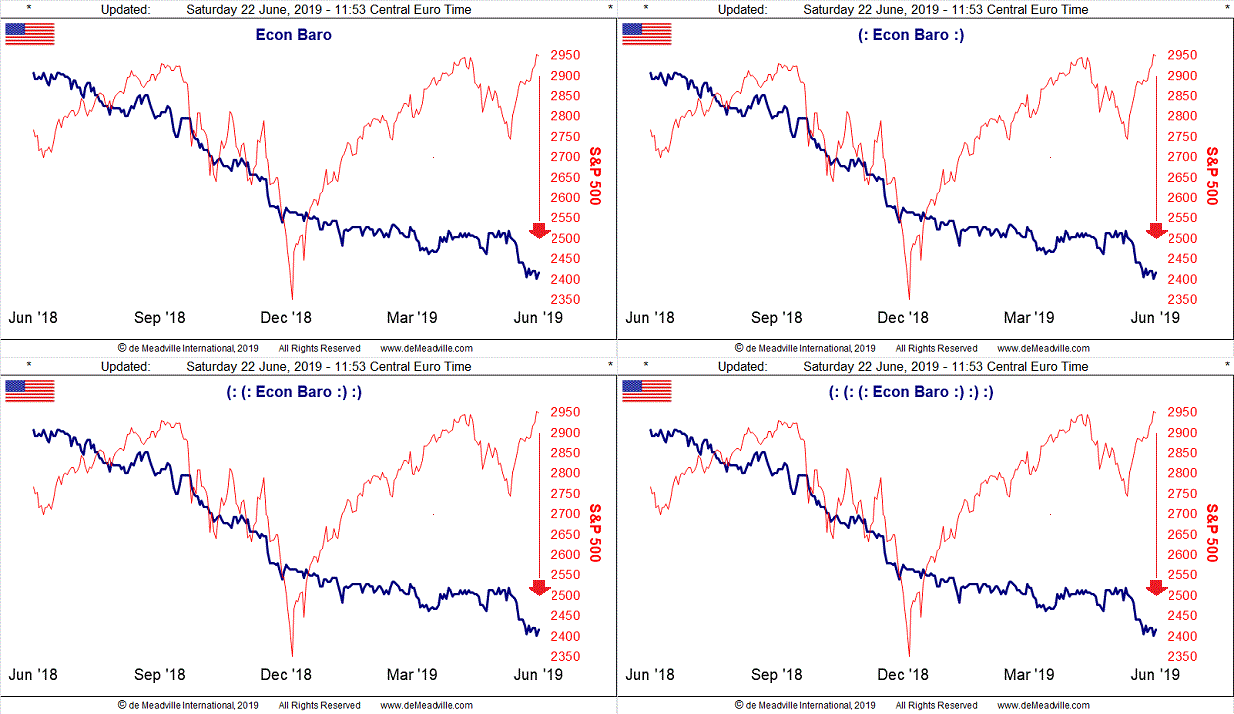
Finally, 'twouldn't be The Gold Update without peeking in on the Economic Barometer and its low juxtaposition to the S&P 500, the red line for which we know ultimately finds its way to the level of the blue line. A business colleague of ours here in Monaco regularly mentions the bafflingly high level of the S&P -- which incontestably 'tis -- be it by earnings (our "live" price/earnings ratio at present 32.1x), or be it by its noted extreme separation from the Econ Baro's blue line, or be it by denial within the insatiability of ignorance in having to own equities. And from inputs of the week just past, save for May's bump in Existing Home Sales, the Baro also accounted for that month's Leading Indicators as not having grown a wit, (hardly surprising given the downward slope of the Baro itself, which is why we prefer to reference the report as one of Lagging Indicators), as well as reeling in June reports for declines in the National Association of Home Builders Index, the Philly Fed Index and the New York State Empire Index, the latter so weak that the number went from May's +17.8 to a -8.6, that -26.4 sweep the worst in nearly nine years since 2010's November reading ... "Goodbye New York!"
In turn to which we say "Hello Gold!" Way to comprehensively breakout above Base Camp 1377!